
One real flight

217 kilometres, and he landed in the field he took off from.

One flight by a beta pilot, as his ParaBaro recorded it: the track on the map, one thermal from inside the wing, and what he got after landing.

The track

The flight on the map

A beta pilot flew out 66.6 km along a ridge, turned, and flew home — on a day with almost no wind to help in either direction. Every kilometre came out of climbs he found himself. This is the record his ParaBaro brought back.
A real cross-country flight drawn over real terrain: a single continuous track threads along a shaded mountain ridge, turning warm where the air was lifting the pilot and cool on the glides between climbs
Above: a real cross-country flight, over real terrain. Warm is air that lifted the pilot; cool is air they paid to cross. Satellite imagery © Esri, Maxar.
A cross-country flight drawn over satellite imagery. Each circle is a climb the pilot found, sized by the height gained in it and coloured by its average strength; warm colours mark the air that was lifting, cool the air they paid to cross.
Each circle is a climb. Warm colours are air that was lifting him; cool is air he paid to cross. Satellite imagery © Esri, Maxar.
5 h 40
airborne without a break
66.6 km
from launch at the furthest point
2,917 m
his highest point of the day
65
separate climbs, worked one after another

One flight, flown by one pilot on one wing. Our evidence base is still small, and we say so.

Inside the wing

One thermal, from inside the wing

The pressure inside the left and right of his wing as he glided into a thermal and began to circle, replayed from his recording.

The yellow line marks the thermal entry, taken from the GPS track.

Airspeed against his own trim shows in straight flight and is blank while he circles and climbs.

After every flight

What he got after landing

Every climb and glide, and the wind at each height you flew through, from your own flight. Your wing's pressure is recorded at two points; wing findings are added to your report once your installation's data passes our checks. During the beta that is still being earned. ParaGuru, the ParaBaro flight analyst, writes a short brief on each flight in plain words.

Two stacked charts covering one five-hour-forty flight. Above, height above sea level against time, with every climbing stretch filled orange and the high point of the day marked at 2,917 m. Below, distance from launch against time, running out to 66.6 km and back to zero.
The whole day in one line. Every climb counted, every glide measured. Swipe the chart sideways to read it.
Left, a compass rose: one petal for each of seven altitude bands, pointing at the direction the wind came from, its length the wind's strength. Right, the same seven bands as a bar chart from 1,353 m up to 2,719 m, each labelled with its wind speed — 2 to 8 km per hour — and the compass point it blew from.
The wind at your altitude, from your own flight. Recovered from the drift of the circles you flew — no wind sensor, no weather report. The wind below cloudbase is rarely the wind at launch, and now you can see the difference. Swipe the chart sideways to read it.
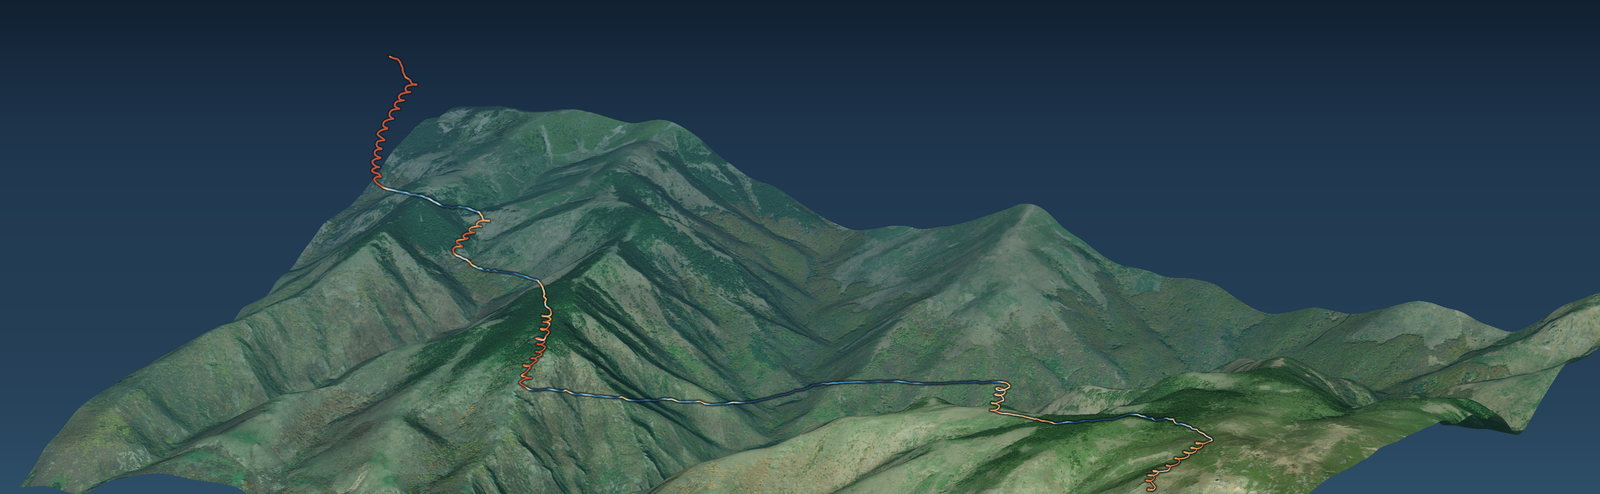
The same flight in three dimensions over satellite terrain: a sawtooth of climbs and glides rising to roughly 1,600 m above the launch field, running from a launch marker on the left to the turn point 66.6 km away on the right.
Your flight where it actually was. Real terrain, real heights — not a line on a flat map.

Every figure above comes from real beta flights. Our evidence base is still small, and we say so. Satellite imagery © Esri, Maxar.

Pilot beta

This is what a ParaBaro flight gives you.

The instrument that reads your wing. The Stick records it on your riser and gives the vario sound in the air. After you land, ParaGuru explains your flight.

£199 including VAT

Beta testers pay £199 including VAT, once. The regular price of the same unit is £395 including VAT. It is yours on delivery: no subscription, nothing to fly off.

Apply for the beta