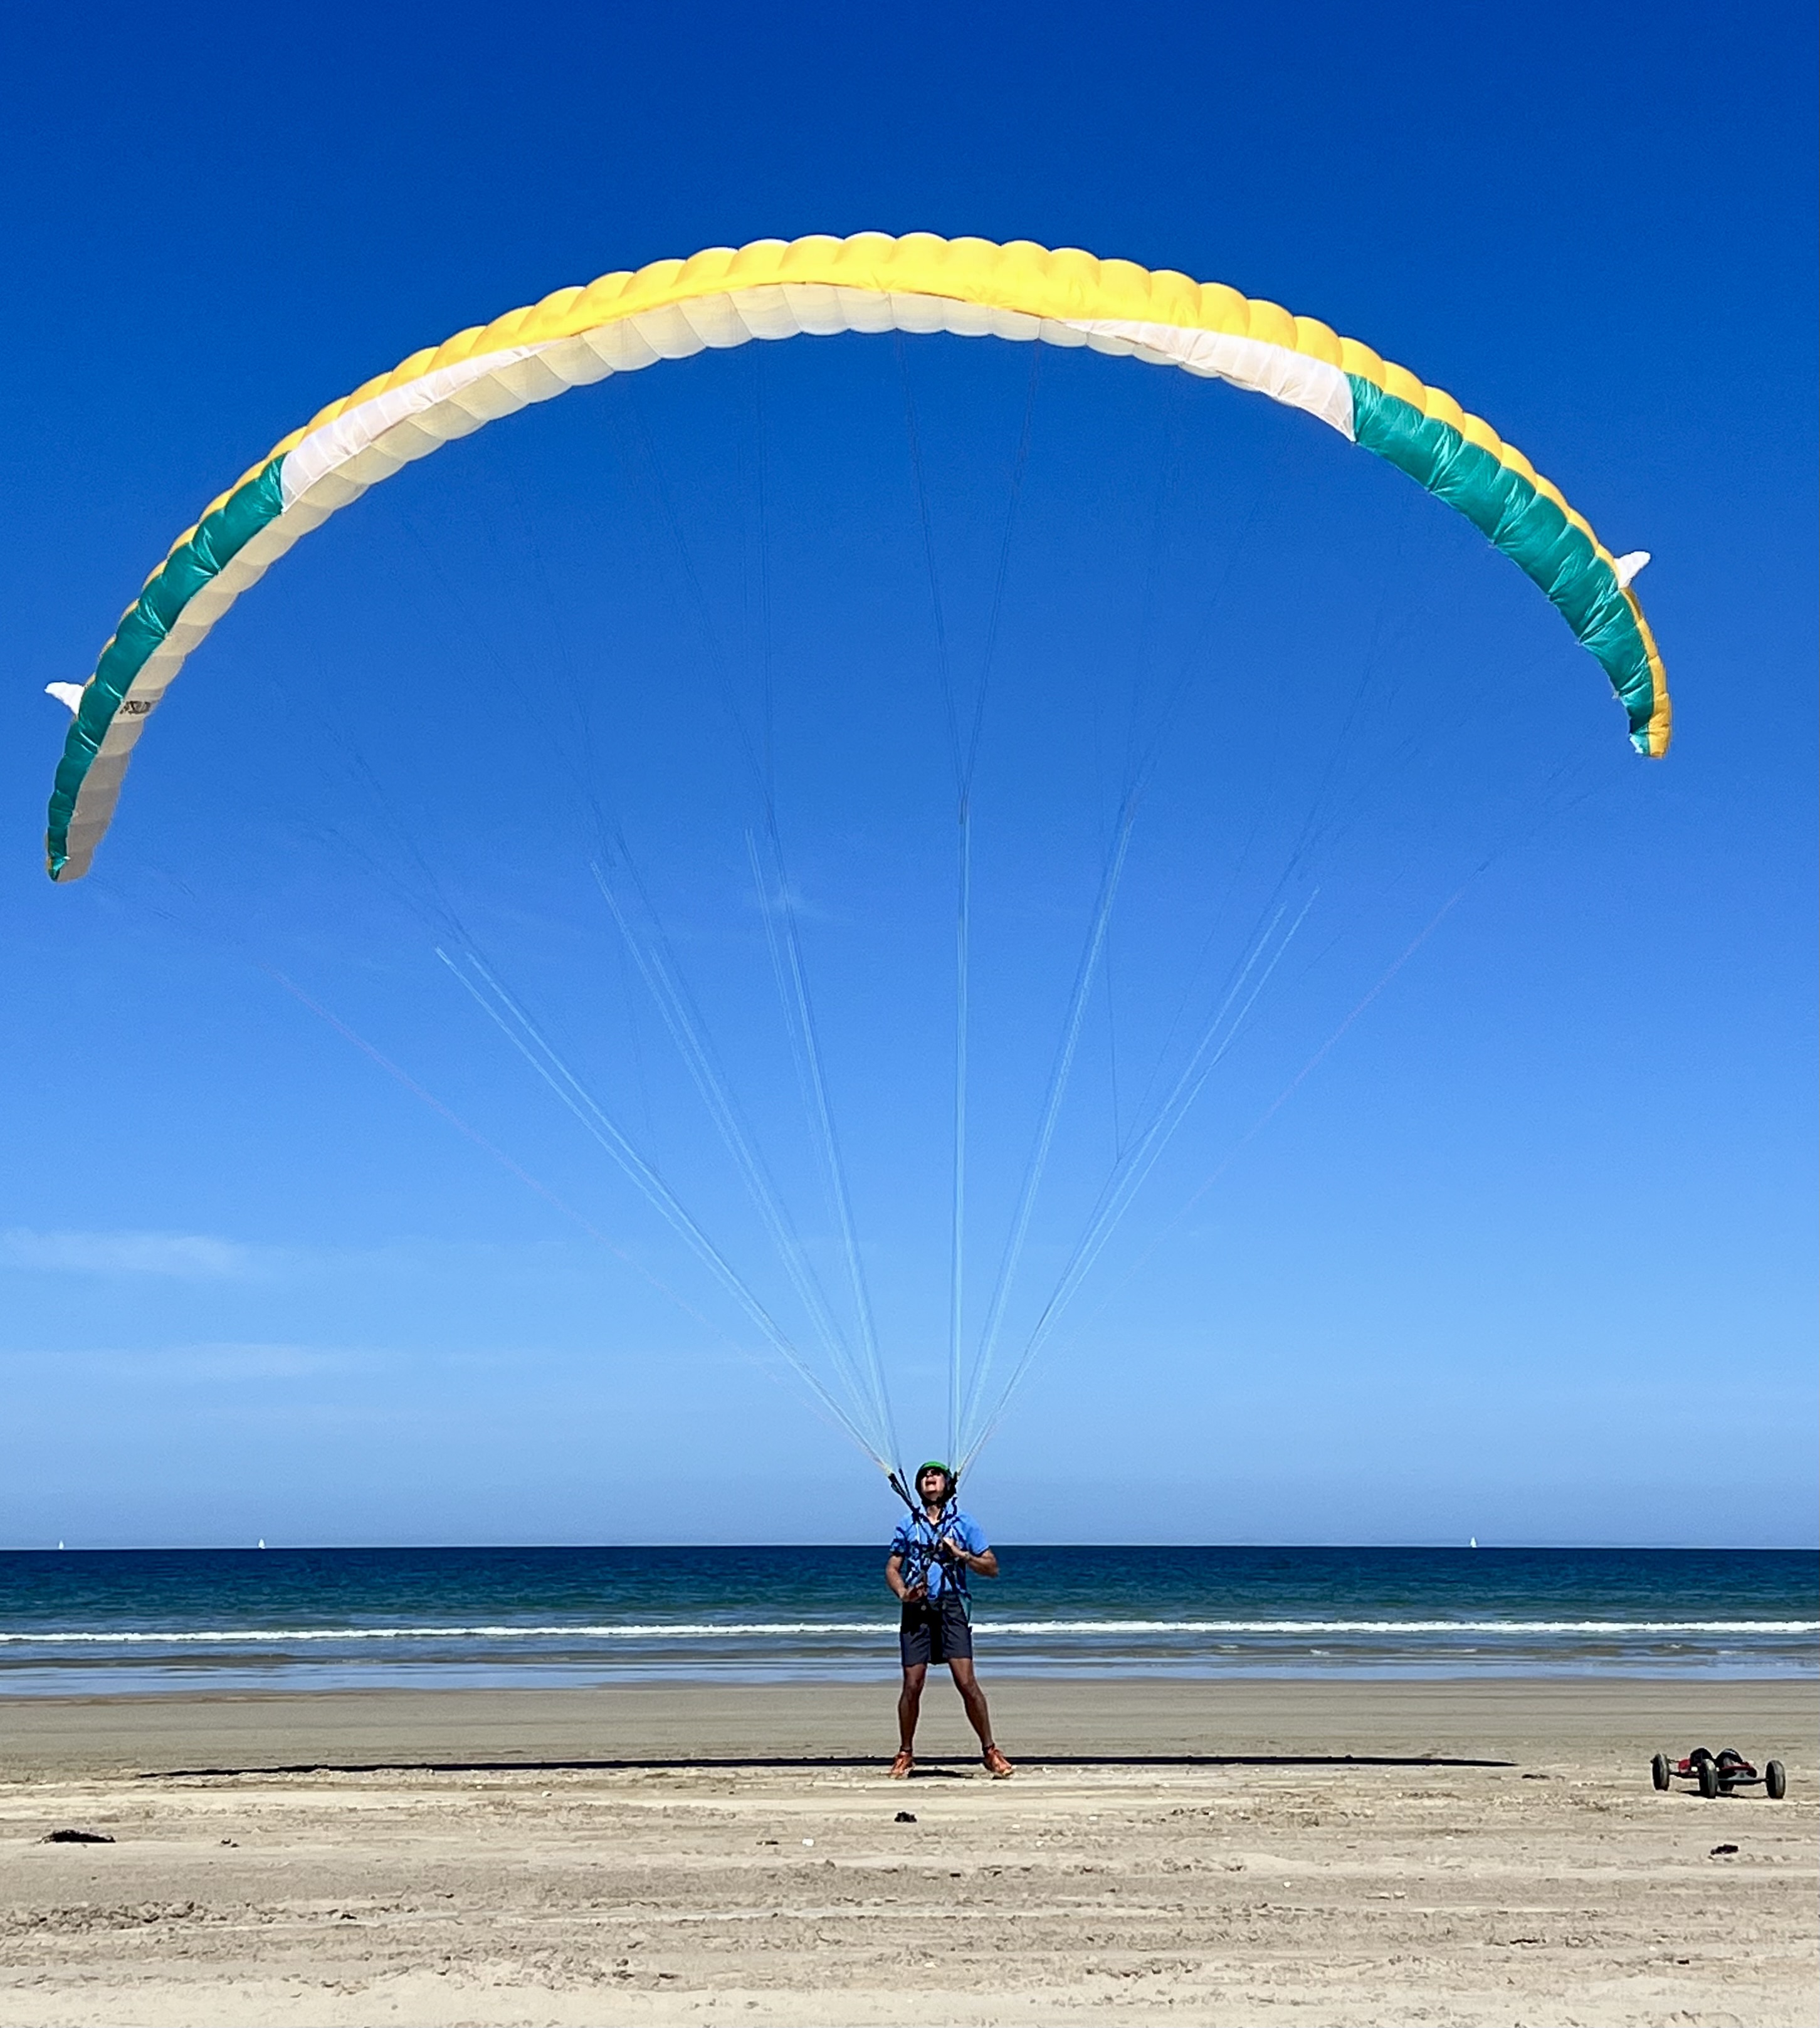
Every paraglider pilot understands collapses at a visceral level. You feel the wing go soft, the surge of adrenaline, the moments of recovery or escalation. But until now, nobody has been able to measure what actually happens to the pressure inside the canopy in the seconds leading up to a collapse.
That's what ParaBaro was built to do. Using paired differential pressure sensors mounted at multiple positions inside the wing, we record the internal canopy pressure at 100 Hz — a hundred readings per second. When combined with GPS, accelerometer, and gyroscope data, this gives us the most complete picture of wing behaviour ever captured in free flight.
The Physics of Internal Wing Pressure
A paraglider wing maintains its shape through internal pressure. Air enters through the leading edge openings, pressurises the cells, and creates the aerofoil shape that generates lift. The pressure inside the canopy is typically 20–200 Pascals above ambient — a tiny margin that keeps you flying.
When that internal pressure drops — because of turbulence, a thermal boundary, or pilot input — the wing loses rigidity. If the pressure drops far enough, the fabric collapses inward and the wing folds. This is what we call a collapse.
Key insight: A collapse doesn't happen instantly. The pressure drop propagates across the wing over 0.5 to 1.5 seconds. That propagation creates a measurable asymmetry between the left and right sides of the canopy — and that asymmetry is detectable before the collapse becomes visible.
What the Data Shows
During our SIV (Simulation d'Incident en Vol) test flights, we captured dozens of induced collapses under controlled conditions. Each one tells the same story in the pressure data:
- Pre-collapse phase (1–2 seconds before): The differential pressure between left and right sensors begins to diverge. One side of the wing starts losing pressure while the other maintains it. This asymmetry is subtle — often just 10–30 Pa above baseline noise — but it's consistent and measurable.
- Collapse initiation (0.5 seconds before): The asymmetry spikes sharply. The affected side drops to near-zero internal pressure while the intact side may actually increase (as airflow redirects). The gyroscope shows the first rotational acceleration.
- Full collapse: The pressure differential peaks at 100+ Pa. The accelerometer registers the dynamic loading. The wing is now visibly folded.
- Recovery phase: As the pilot (or wing's inherent stability) corrects, the pressures equalise and the asymmetry returns to baseline over 2–5 seconds.
The Critical Window
The most important finding is the pre-collapse phase. Between the first measurable pressure asymmetry and the full collapse, there is a window of 0.5 to 1.5 seconds — depending on the severity and type of event. During this window, the pressure data clearly indicates that something abnormal is happening, even though a pilot looking at the wing might not see anything yet.
This is the window where an alert could make a real difference. Not after the collapse has happened — but before it becomes visible.
0.5–1.5 seconds
The advance warning window before a visible collapse
From Data to Detection
Capturing the data is only the first step. The real challenge is building a machine learning model that can distinguish between a genuine pre-collapse pressure signature and normal turbulence, pilot inputs, or thermal entry — all of which also cause pressure fluctuations.
This is why the ParaBaro beta programme exists. We need thousands of hours of labelled flight data — flights where pilots confirm what events occurred — to train models that can reliably detect these patterns in real time. Every flight uploaded by our beta pilots makes the detection model more accurate.
What This Means for Pilots
We're not claiming that ParaBaro prevents collapses — nothing can change the physics of turbulent air. But we are building the first instrument that can see a collapse developing before it becomes visible, giving pilots a critical extra moment to prepare, weight-shift, or brake. For student pilots and those flying in challenging conditions, that fraction of a second could be the difference between a controlled recovery and a cascade.
If you're interested in contributing to this research — and earning credits while flying your normal hours — learn more about the ParaBaro beta programme.